Contents · 12
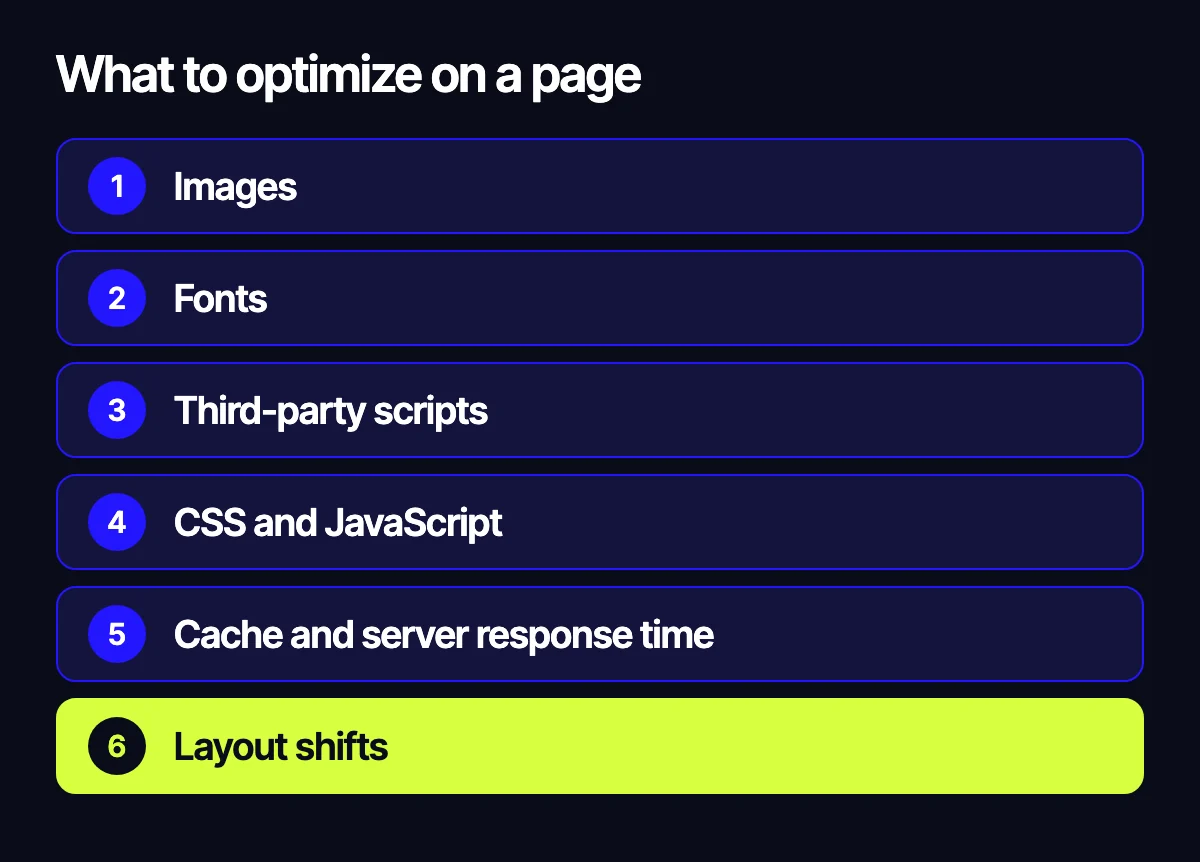
- What PageSpeed Insights shows
- The metrics: LCP, INP, CLS, FCP and TBT
- Images
- Fonts
- Third-party scripts: GTM, pixels, chats
- CSS and JavaScript
- Page cache and server response time
- Layout shifts: CLS
- Breakdown: how we optimized ntsame.agency
- Speed, SEO and sales
- Page optimization checklist
- We’ll speed up your site
PageSpeed Insights gives you a score from 0 to 100 and a long list of suggestions. That makes it look as if the job is to push the number into the green at any cost. In fact the score is only a summary. What matters is which metrics fall short and what on the page is dragging them down.
Below: how to read the report, what LCP, INP, CLS, FCP and TBT mean, the most common causes and how to fix them. At the end – a breakdown of our own site, ntsame.agency, with real numbers, and a checklist.
What PageSpeed Insights shows
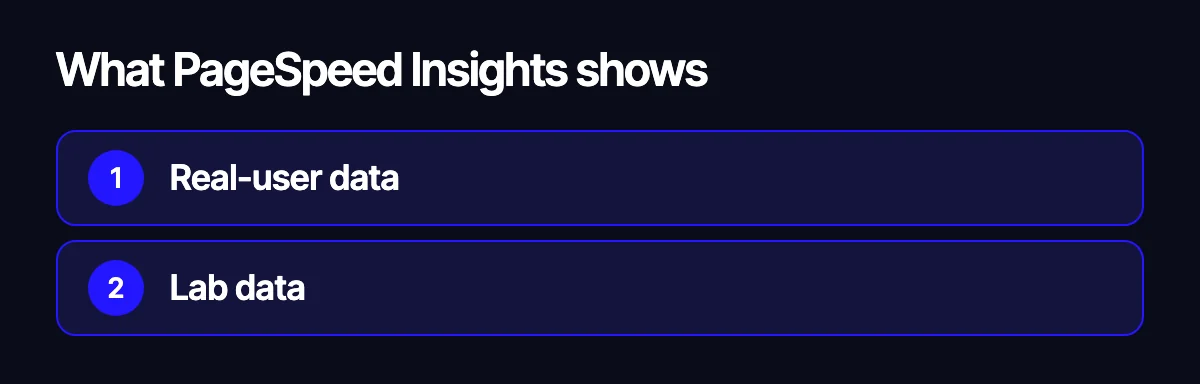
The report has two different kinds of data, and it is important not to mix them up.
- Real-user data (field data). These are Core Web Vitals from the Chrome UX Report: how the site loaded for actual visitors over the last 28 days. The 75th percentile is assessed: a metric is “good” if the page was that fast for at least three visitors out of four. This is the data Google uses as a ranking signal. Sites with little traffic may not have this section at all.
- Lab data (Lighthouse). A single test run on Google’s servers: for mobile, it emulates a mid-range phone on a throttled mobile connection. This is where the 0–100 score comes from. The lab test is handy for finding causes and checking fixes, but results vary by a few points from run to run.
Start with the Mobile tab: the test conditions there are tougher, and most shoppers arrive on a phone. Score colours: 90–100 is green, 50–89 orange, 0–49 red.
The metrics: LCP, INP, CLS, FCP and TBT
Core Web Vitals are three metrics: LCP, INP and CLS. FCP and TBT are supporting metrics, but they help you find causes. The thresholds below are Google’s recommendations.
| Metric | What it measures | Good | Poor |
|---|---|---|---|
| LCP | When the largest element of the first screen is rendered: the main image, banner or heading | up to 2.5 s | over 4 s |
| INP | How quickly the page responds to taps, clicks and typing – based on the slowest response during a visit | up to 200 ms | over 500 ms |
| CLS | How much the layout shifts while loading | up to 0.1 | over 0.25 |
| FCP | When anything at all appears on screen: text, background, logo | up to 1.8 s | over 3 s |
| TBT | How long the browser’s main thread is busy with scripts and can’t respond to input (lab test only) | up to 200 ms | over 600 ms |
TBT, LCP and CLS carry the most weight in the lab score. INP can’t be measured in a lab test – there is no real user – so TBT stands in for it: if the main thread is busy with scripts for a long time, the page will be slow to respond to taps in real life too.
Images
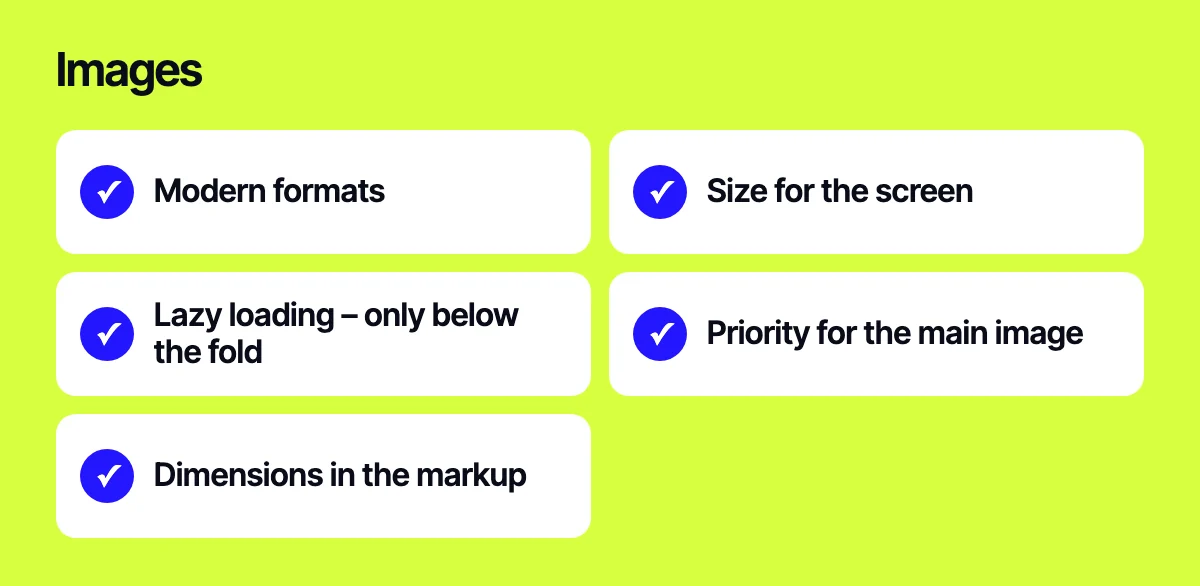
Images are the most common cause of a poor LCP: the hero banner weighs a megabyte, is served at the size for a huge monitor or waits in line behind a dozen other files.
- Modern formats. WebP is usually noticeably lighter than JPG and PNG at the same quality, and AVIF is lighter still. Browsers can receive the new format automatically, with the old files kept as a fallback.
- Size for the screen. The
srcsetandsizesattributes let you send a phone an image sized for its width rather than for a wide monitor. - Lazy loading – only below the fold.
loading="lazy"on images further down the page saves data. But never defer the main image of the first screen: that directly hurts LCP. - Priority for the main image.
fetchpriority="high"tells the browser to load it before everything else. - Dimensions in the markup.
widthandheighton every image reserve space in advance so the layout doesn’t jump – that’s CLS.
Fonts
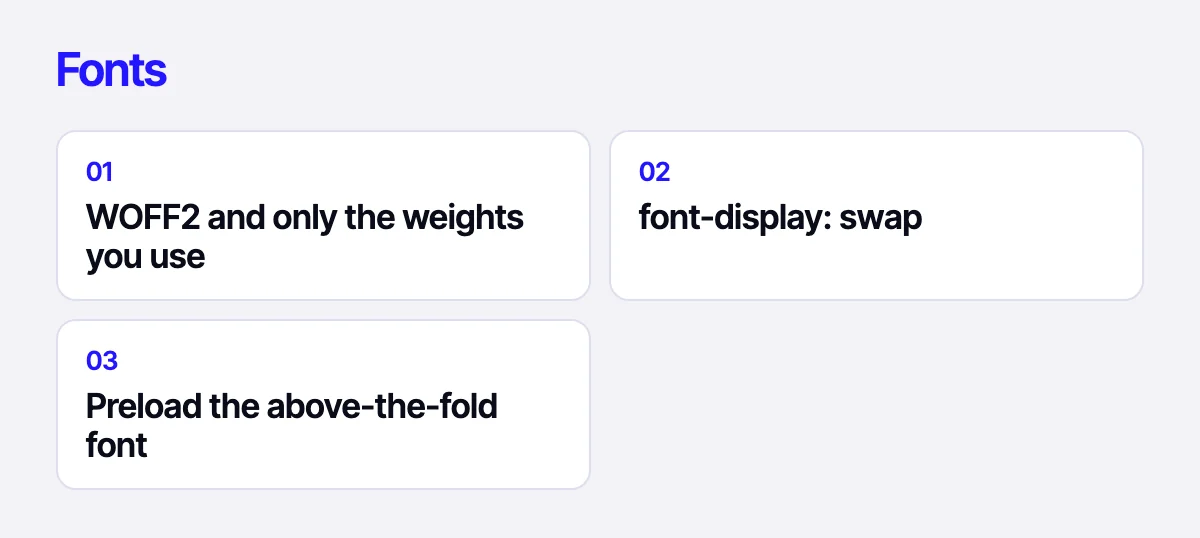
A web font can hold back text: the browser waits for the file and doesn’t show the heading until it arrives.
- Use WOFF2 and load only the weights and character sets you need (for example, Latin and Cyrillic as separate files).
- Add
font-display: swapso text shows right away in a system font and is swapped once the web font loads. - The main font of the first screen can be loaded early with
<link rel="preload">. Five weights of one font is a reason to ask whether you need them all.
Third-party scripts: GTM, pixels, chats

Google Tag Manager, Meta Pixel, Microsoft Clarity, live chats, review and call-back widgets – each script is small on its own, but together they occupy the main thread exactly when the page should be rendering. In the report this shows up as a high TBT and the “Reduce the impact of third-party code” audit.
- Delayed start. Analytics and marketing scripts start not on load but after the visitor’s first interaction: a scroll, click, tap or key press. A visitor reading the page never notices them.
- Chat on demand. Instead of the full widget on load, show a lightweight button and load the chat itself on click.
- Clean-up. Pixels from long-finished ad campaigns and forgotten test trackers turn up on almost every site. Remove what you don’t use.
Delaying scripts has a cost: visits that end without a single interaction won’t be seen by the trackers. For most sites this is acceptable, but make the decision deliberately, together with marketing.
CSS and JavaScript
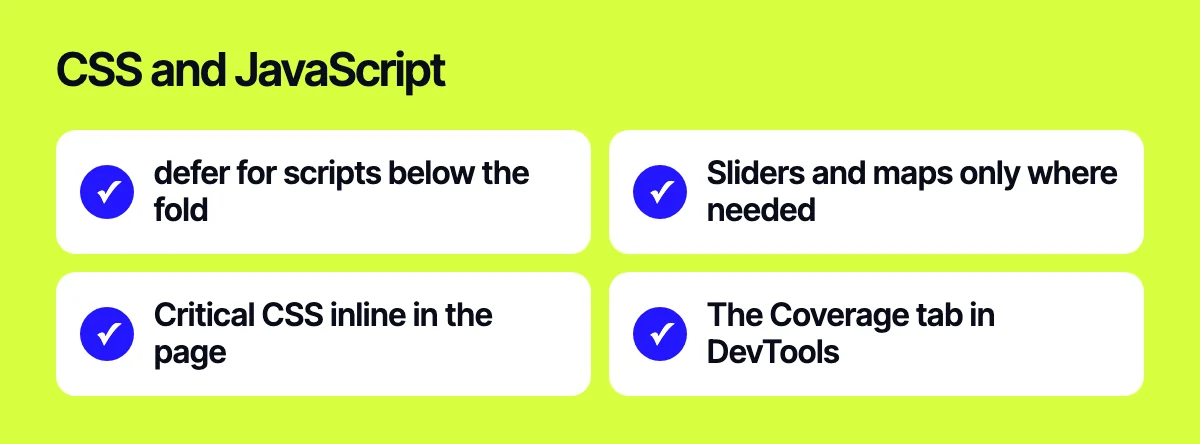
- Load scripts that aren’t needed for the first screen with
deferso they don’t block rendering. - Don’t load everything everywhere: a slider, a map and a shipping calculator are needed on one or two pages, not on every page. This applies especially to WordPress plugins and OpenCart modules.
- Styles needed for the first screen can be inlined in the page, with the rest loaded later.
- The Coverage tab in Chrome DevTools shows how much of the CSS and JS on a page is never used.
Page cache and server response time
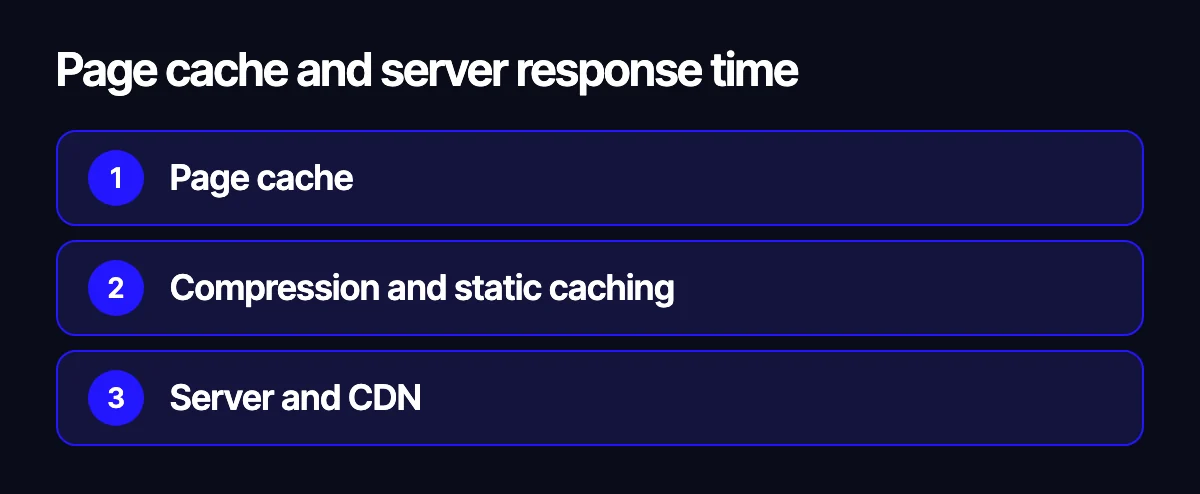
TTFB is the time it takes the server to start sending the page. Until then the browser does nothing, so a slow server response pushes back every other metric. Google’s guideline is up to 0.8 s.
- Page cache. On WordPress and OpenCart each page is built from scratch by default: database queries, plugins, templates. A cache stores the ready HTML and serves it without that work.
- Compression and static caching. Gzip or Brotli for text, long cache lifetimes for images, styles and scripts with a version in the file name.
- Server and CDN. If the response is still slow with a cache, the problem is the hosting or the distance to your visitors. But move only after the causes in the code are fixed.
Layout shifts: CLS
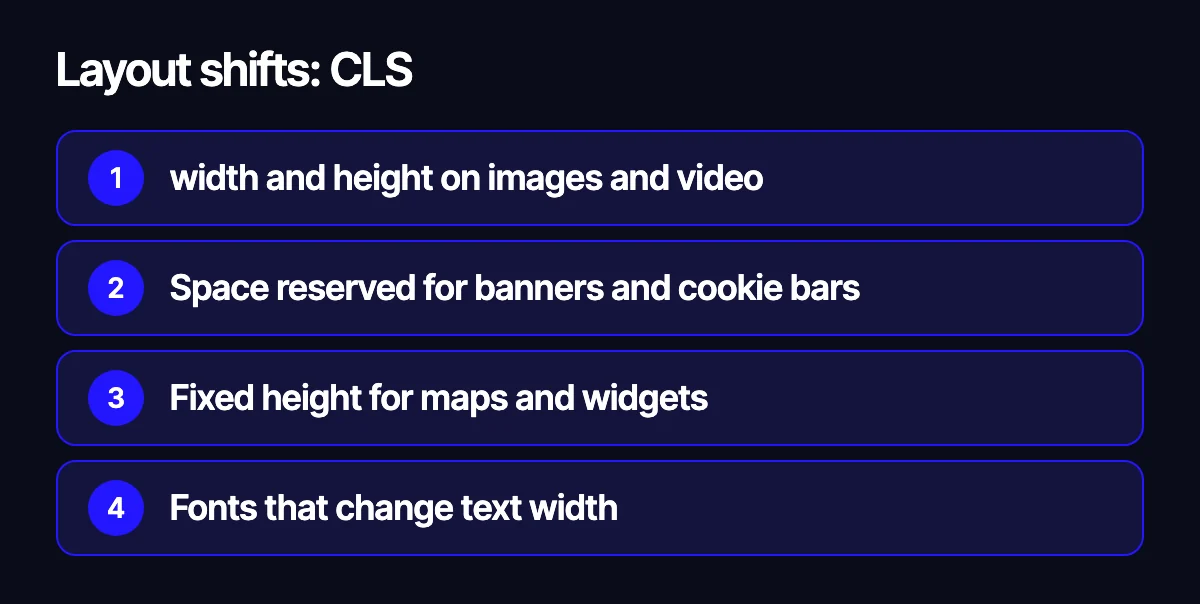
CLS grows when something appears on the page later than the rest and pushes the text around. A shopper aims at a button and hits a banner instead.
- Images and videos without
widthandheight(oraspect-ratioin CSS). - Banners, cookie notices and promo bars inserted above the content. Reserve space for them or show them on top of the page.
- Embeds: maps, videos, review widgets – give the container a fixed height.
- Fonts that noticeably change the width of text once they load.
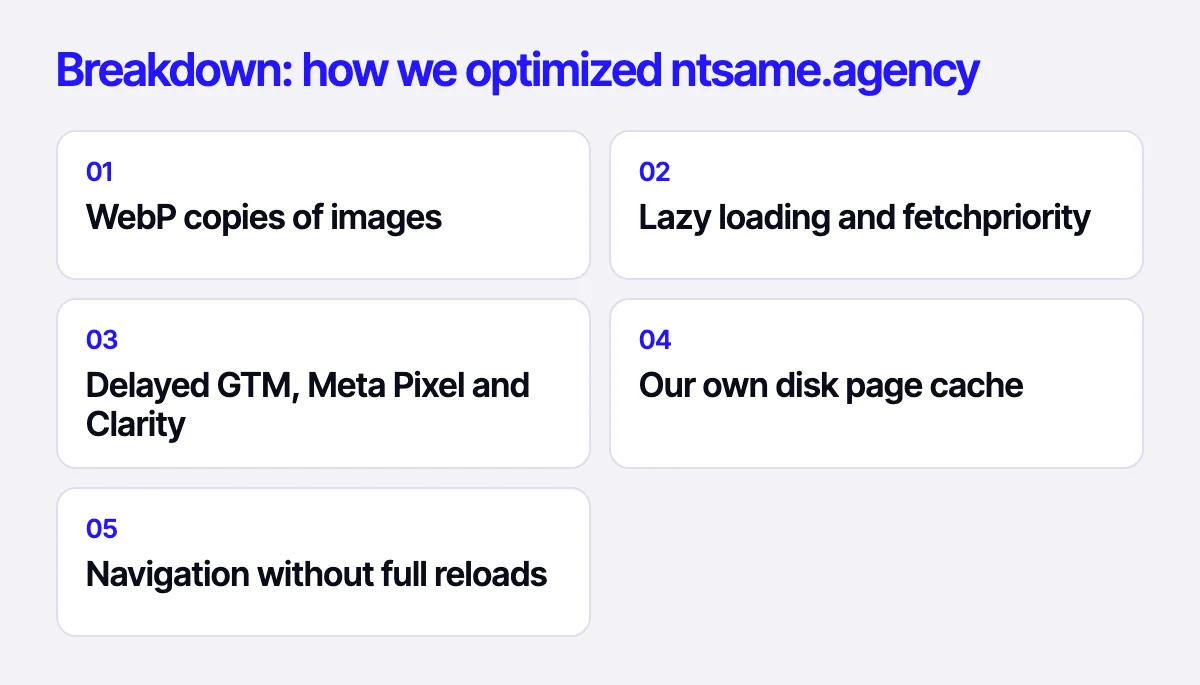
Breakdown: how we optimized ntsame.agency
Our site runs on WordPress with a custom theme. Here is the /locations/dubai/ page in PageSpeed Insights:
| Category | Mobile | Desktop |
|---|---|---|
| Performance | 96 | 90 |
| Accessibility | 97 | 97 |
| Best Practices | 100 | 100 |
| SEO | 100 | 100 |
Desktop metrics: FCP 0.3 s, LCP 0.5 s, TBT 0 ms, CLS 0.001. What we did to get there:
- WebP copies of images. Theme and media library images get WebP versions, and browsers receive the lighter file automatically.
- Lazy loading and fetchpriority. Everything below the fold loads as you scroll; the main image loads with high priority.
- Delayed GTM, Meta Pixel and Clarity. Trackers start after the visitor’s first interaction, so they take no part in the first load – hence a TBT of 0 ms.
- Our own disk page cache. Ready HTML is served without starting WordPress. Server response time went from 0.6 to 0.15 s.
- Navigation without full reloads. The Swup library swaps only the page content, so the header, styles and scripts aren’t loaded again on each click.
More about this work on our website speed optimization page, which also has the ntsame.agency case study with mobile and desktop scores.
Speed, SEO and sales
Core Web Vitals are one of Google’s ranking signals, but not the main one: content matters more. Speed has a bigger effect on behaviour. People close a slow page before the first screen appears, which is why speed is one of the points in our CRO checklist for online stores.
If a redesign or migration is coming up, put speed into the spec from the start and don’t lose rankings during the move – see our site migration checklist. What you can optimize also depends a lot on the platform: compare them in OpenCart, WooCommerce, Shopify or Laravel.
Page optimization checklist
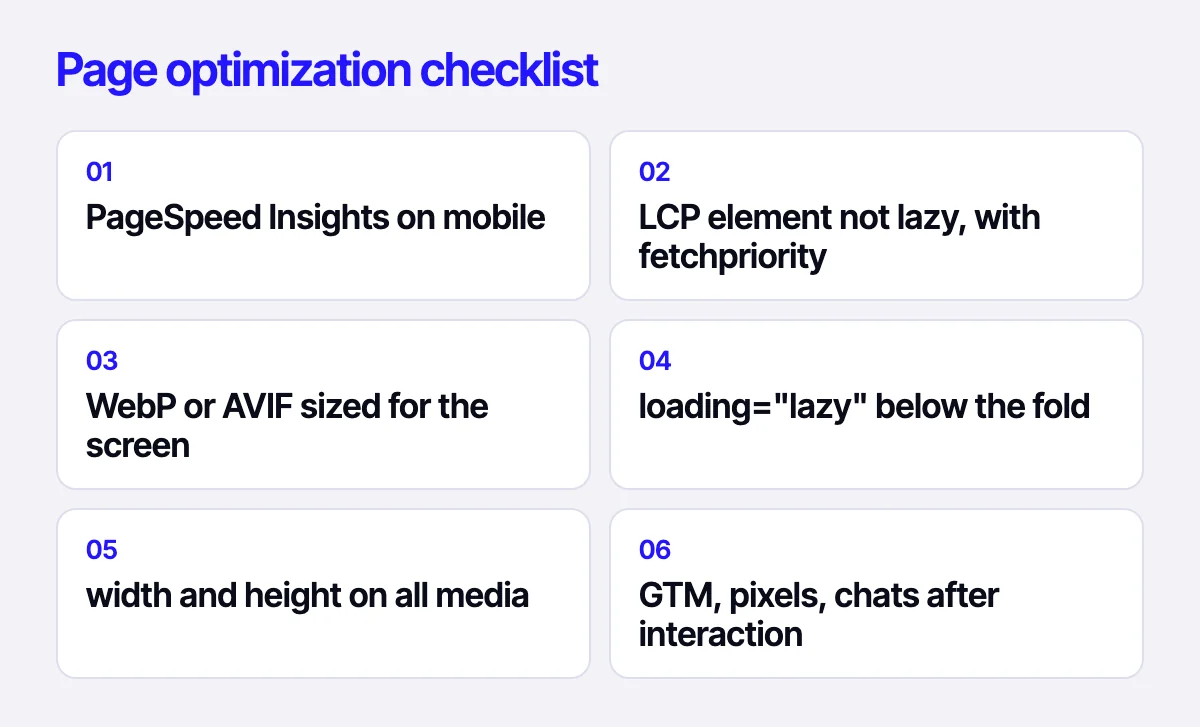
- Test the page in PageSpeed Insights on the Mobile tab and compare field and lab data.
- Find the LCP element in the report and make sure it isn’t lazy-loaded and has
fetchpriority="high". - Convert images to WebP or AVIF and serve them at the size of the screen.
- Add
loading="lazy"to images below the fold. - Set
widthandheighton all images, videos and embeds. - Keep only the font weights you need, in WOFF2, with
font-display: swap. - Delay GTM, pixels, chats and widgets until the visitor’s first interaction.
- Remove unused trackers, plugins and libraries.
- Load scripts with
deferand don’t load them on pages that don’t need them. - Turn on page caching, compression and static file caching. Check TTFB.
- Reserve space for banners and notices so the layout doesn’t shift.
- Repeat the test several times and check the field data again after 28 days.
Related reading: 12 places where an online store loses buyers; redesign without losing rankings; how website speed affects sales.
We’ll speed up your site
We’ll measure your key pages, show what exactly slows them down and fix it in the code – no redesign needed. Details on our website speed optimization page. Write to us through the form on the site, on Telegram, WhatsApp or by e-mail.
Leave your contact – we'll reply within one business day wherever suits you.